
Venn diagrams blow.
Multiset Venn diagrams both blow and suck:
Don’t make them; and
Don’t make me interpret them; and
Don’t try and put them in your presentations because you’ll get lost.
UpSetR provides a way to do the multi-set comparison thing without looking horrific.
We sample a few sets from the letters b-z:
library("UpSetR")

set.seed(1)

bucket_names <- paste0("set", 1:6)

buckets <- Map(
  function(x){
    bucket_size <- sample(1:25, 1)
    bucket <- sample(letters[-1], bucket_size, replace = FALSE)
    },
  bucket_names
  )
lapply(buckets, sort)## $set1
## [1] "f" "k" "n" "o" "t" "v" "x"
##
## $set2
## [1] "c" "d" "f" "h" "i" "j" "k" "m" "n" "o" "q" "r" "s" "w" "y" "z"
##
## $set3
## [1] "b" "e" "i" "k" "l" "m" "p" "v" "x" "y"
##
## $set4
## [1] "b" "c" "d" "f" "g" "i" "k" "l" "n" "o" "p" "q" "s" "t" "u" "v" "w"
## [18] "x" "y" "z"
##
## $set5
## [1] "c" "f" "h" "j" "k" "n" "q" "r" "s" "t" "v" "w" "y"
##
## $set6
## [1] "b" "c" "d" "e" "f" "g" "i" "j" "k" "l" "m" "n" "p" "q" "r" "s" "t"
## [18] "u" "w" "x" "z"The function upset takes a data-frame as input. But I’ve just defined my sets as a list of vectors. To convert these into a data-frame, use UpSetR::fromList:
fromList(buckets)## set1 set2 set3 set4 set5 set6
## 1 1 1 1 1 1 1
## 2 1 1 0 1 0 0
## 3 1 0 1 1 1 0
## 4 1 1 0 1 1 1
## 5 1 0 0 1 1 1
## 6 1 0 1 1 0 1
## 7 1 1 0 1 1 1
## 8 0 1 0 1 1 1
## 9 0 1 1 1 1 0
## 10 0 1 0 1 1 1
## 11 0 1 0 0 1 1
## 12 0 1 0 1 1 1
## 13 0 1 0 0 1 1
## 14 0 1 0 0 1 0
## 15 0 1 1 0 0 1
## 16 0 1 0 1 0 1
## 17 0 1 1 1 0 1
## 18 0 1 0 1 0 1
## 19 0 1 0 1 1 1
## 20 0 0 1 1 0 1
## 21 0 0 1 1 0 1
## 22 0 0 1 0 0 1
## 23 0 0 1 1 0 1
## 24 0 0 0 1 0 1
## 25 0 0 0 1 0 1The letter ‘a’ is absent from every one of these sets. you could add a universe entry or an unobserved entry to the set-list passed to fromList if that’s what you’re into.
Otherwise, to generate an upset plot do the following:
upset(
  fromList(buckets)
  )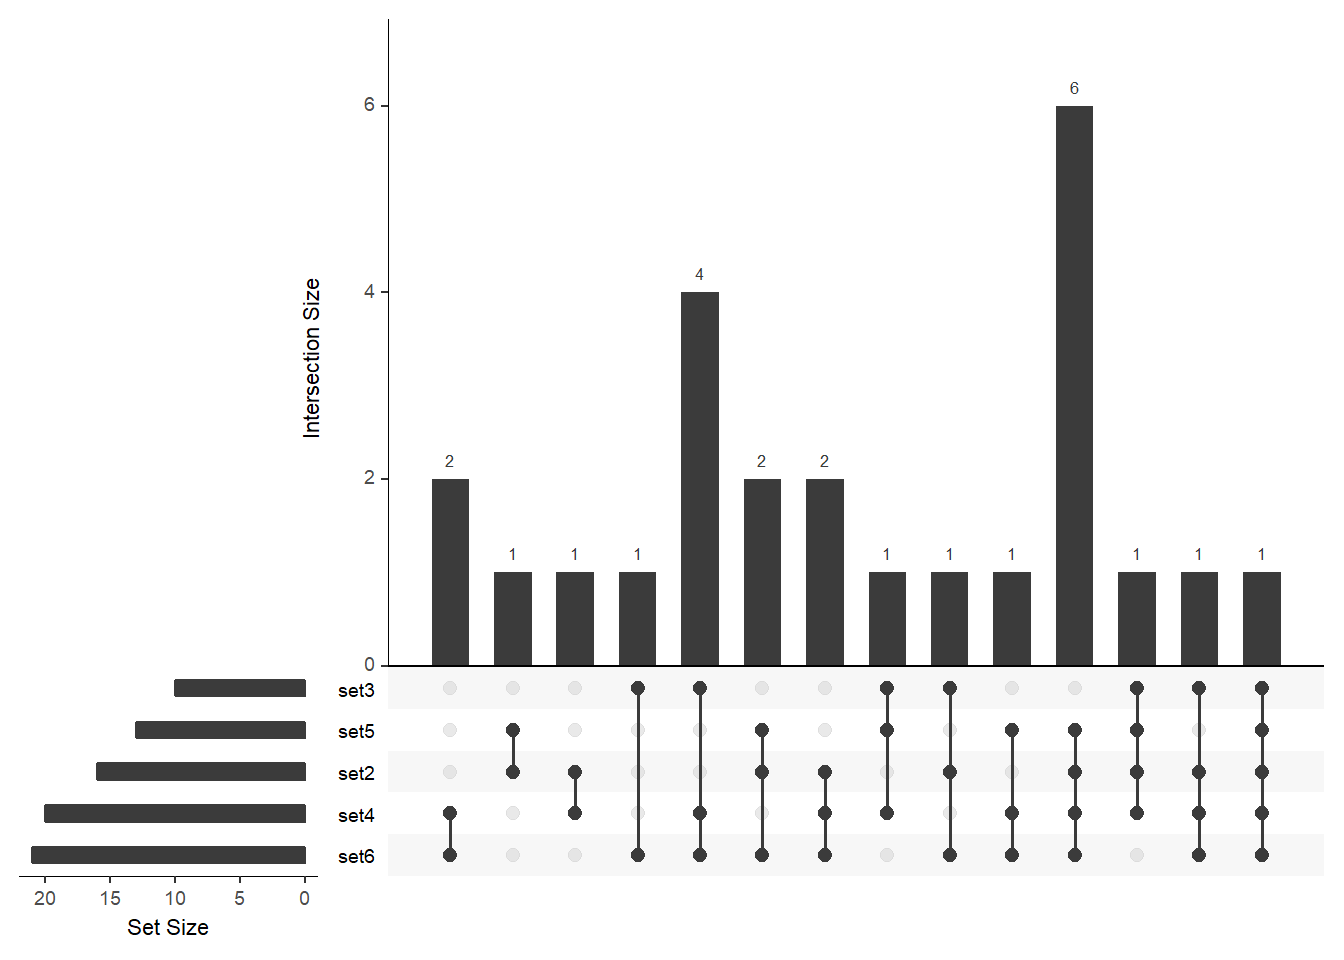
We note a couple of things:
set1is absent from the image, although it contained 7 elements;the elements of a given set are partitioned between the bars
- eg,
set3contains 9 elements, that are split over the 4-5th, 8-9th and 12-14th columns (the numbers above these columns add up to 9) so each element in set3 is put into a single column that means, although the intersection between set3 and set6 is of size 8, there is only one element in the “set3 and set6” intersection column (the remaining 6 are partitioned across the other columns that contain both set3 and set6).
- eg,
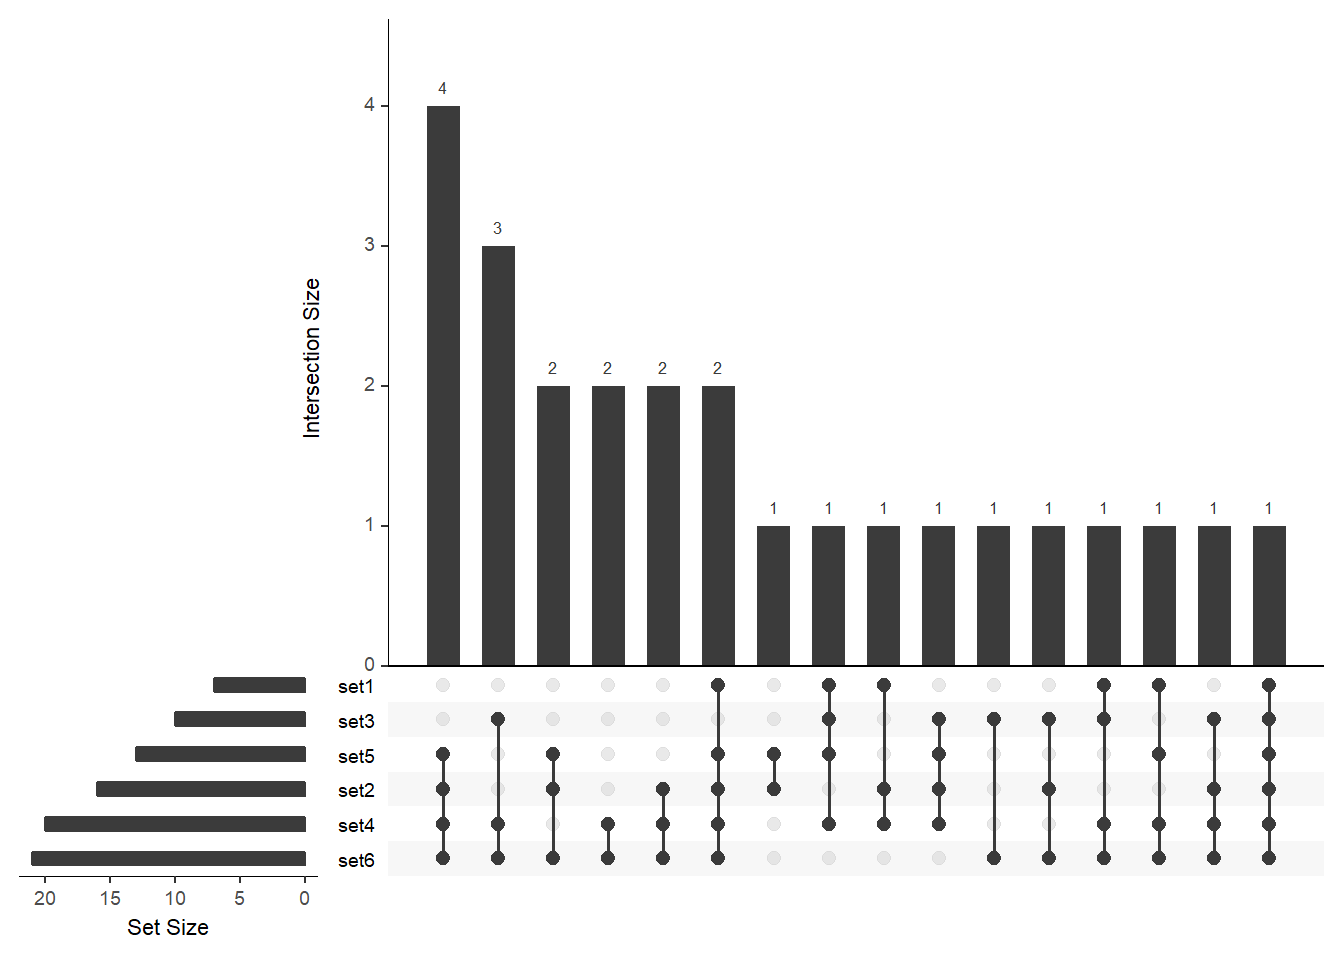
To ensure that all the sets are displayed in the figure, modify the nsets argument: You can order the bars by size (order.by = "freq") or by the number of sets that contributed to the intersection (order.by = "degree") or by both:
# order by freq
upset(
  fromList(buckets), nsets = length(buckets), order.by = "freq"
)
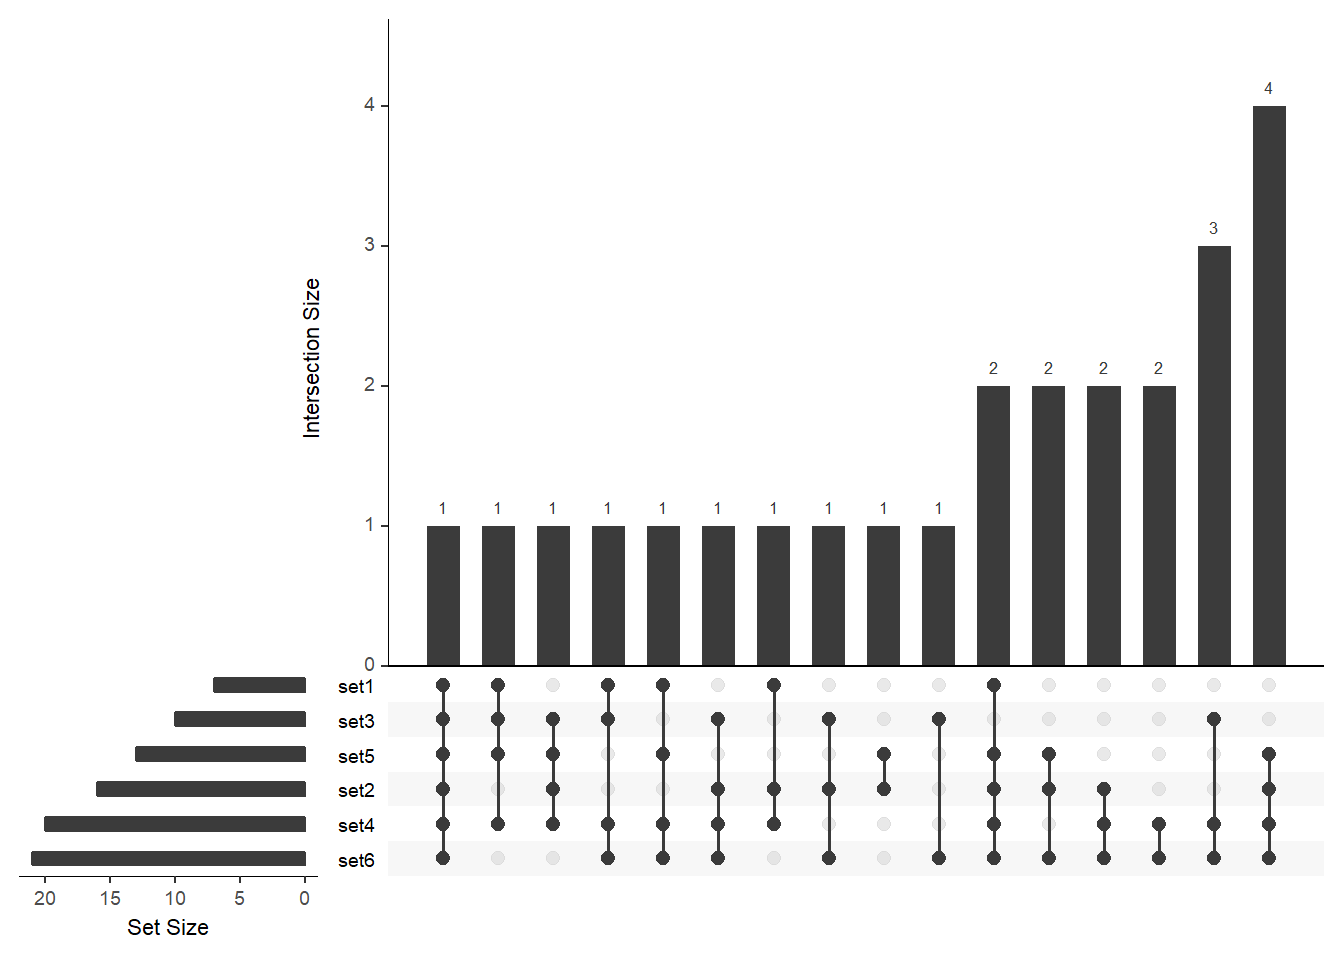
# order by degree and then by freq (not shown)
upset(
  fromList(buckets), order.by = c("freq", "degree"),
  nsets = length(buckets)
  )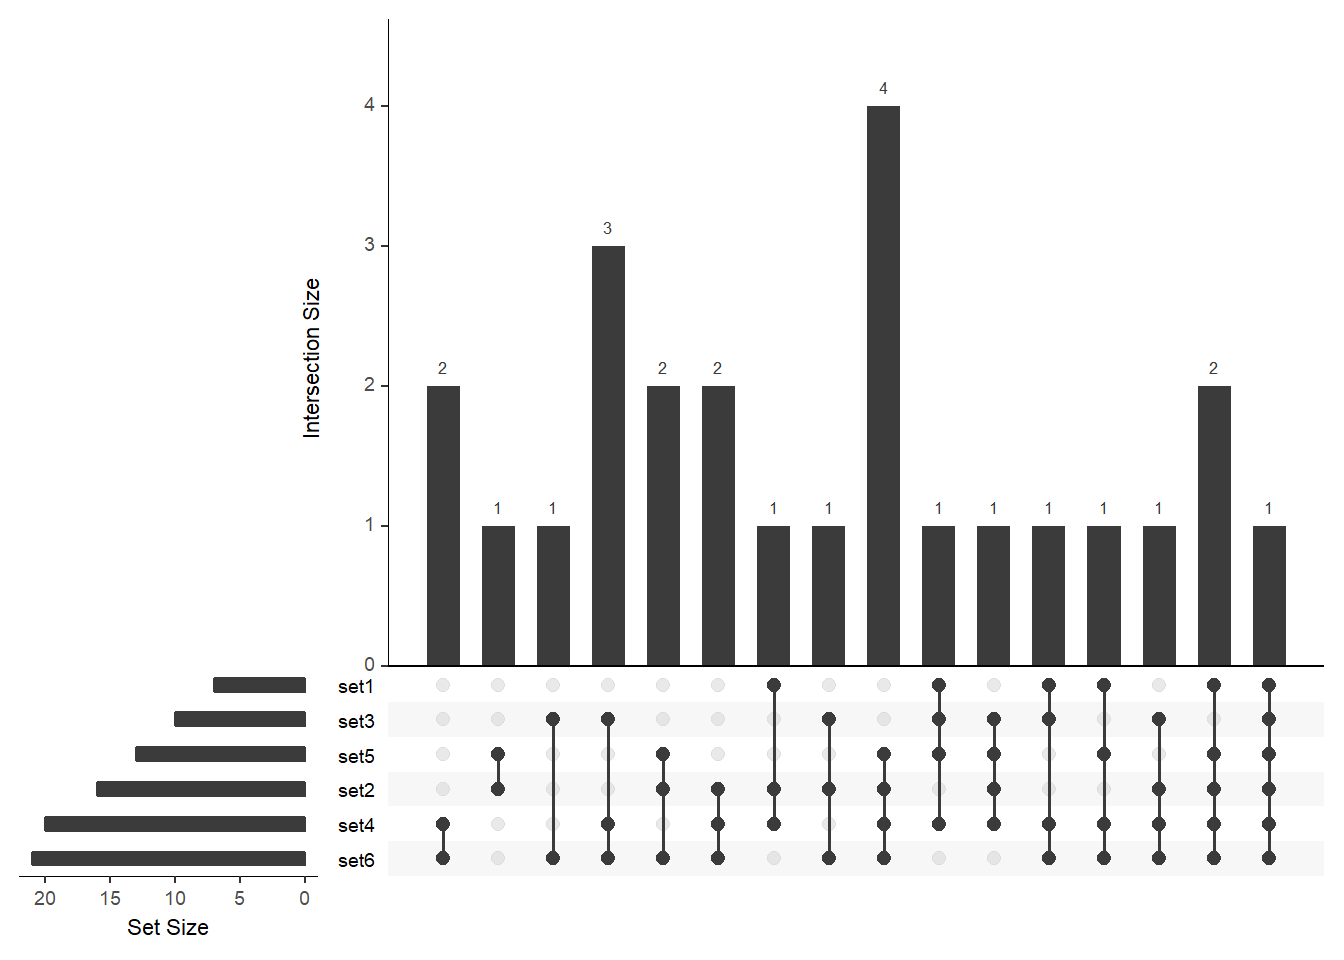
# order by freq and then by degree
upset(
  fromList(buckets), order.by = c("degree", "freq"),
  nsets = length(buckets)
  )
I found the latter a bit weird, in that order.by = c(“degree”, “freq”) sorts by increasing frequency, whereas order.by=“freq” sorts by decreasing frequency.